
How We Score an IPO Out of 100 (And Why We Don’t Just Look at the Hype) ?
Every IPO season, the same thing happens. A company files its DRHP, the grey market premium starts doing the rounds on Telegram, influencers post “MUST APPLY 🔥” reels, and retail investors are left trying to figure out whether they’re buying into a genuinely good business – or just good marketing.
We built a scoring framework to cut through that noise. It’s not a black box, and it’s not a gut-feel rating either. It’s a structured, document-first system that reads the DRHP the way a serious analyst would, and converts qualitative business reality into a number out of 100.
Here’s how it works — and just as importantly, why we built it this way.
We start with the DRHP, not the narrative
The Draft Red Herring Prospectus is the single most honest document a company will publish about itself before listing.
It’s audited, it’s regulated, and companies can’t spin it the way they spin an investor call or a press release. So instead of starting with “what’s the buzz,” we start with “what does the filing actually say.”
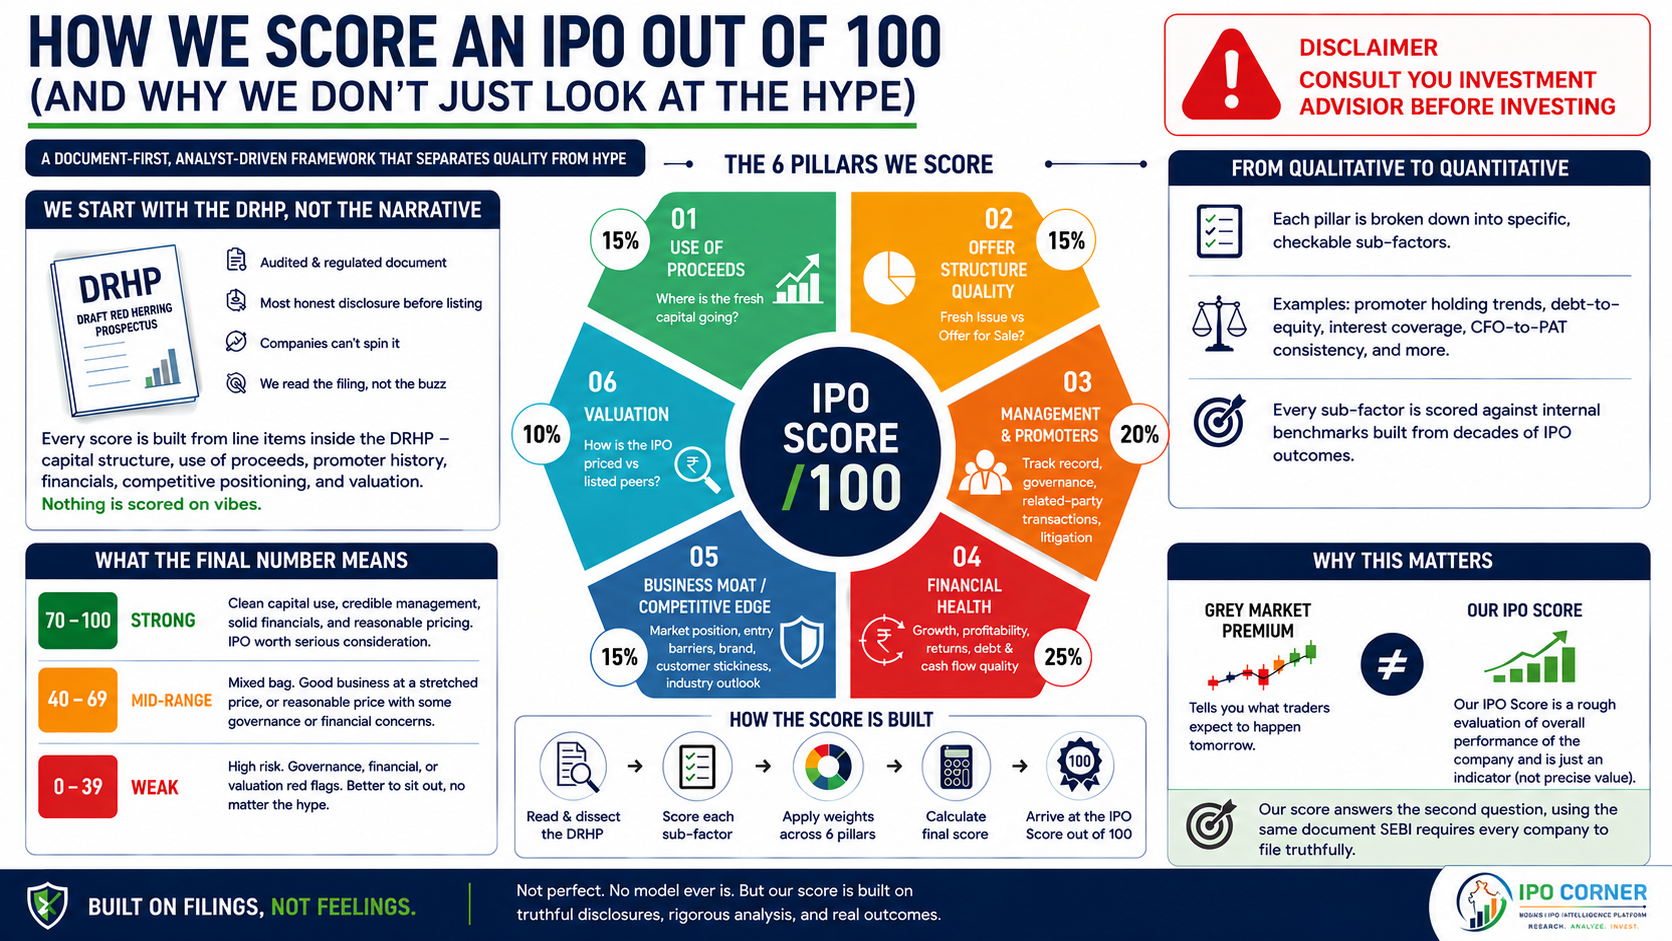
Every score we publish is built from line items inside the DRHP — capital structure, use of proceeds, promoter history, financials, competitive positioning, and valuation. Nothing is scored on vibes.
The six pillars we score
We break every IPO down into six broad dimensions.
Each one captures a different kind of risk or opportunity that retail investors typically don’t have the time (or the filing-reading patience) to evaluate themselves:
- Use of Proceeds – Where is the fresh capital actually going? Growth capex, debt reduction, and expansion tell a very different story than “general corporate purposes,” which is often a red flag for vague capital planning.
- Offer Structure Quality – How much of the issue is a fresh issue (money going into the company) versus an Offer for Sale (money going straight to existing shareholders, including promoters or PE investors cashing out)?
- Management & Promoters – Track record, governance history, related-party dealings, capital allocation discipline, and any regulatory or litigation baggage. This is where a lot of “good business, risky bet” situations get flagged.
- Financial Health – Revenue growth, profitability trends, return ratios, debt position, and cash flow quality relative to reported profit. We specifically look at whether accounting profit is backed by real cash generation.
- Business Moat / Competitive Edge – Market position, entry barriers, brand strength, customer stickiness, and whether the industry itself has tailwinds or headwinds.
- Valuation – How the IPO is priced relative to listed peers, on earnings, margins, and growth-adjusted metrics — because even a great business can be a bad investment at the wrong price.
Each of these pillars carries a different weight in the final score, reflecting how much it typically matters to long-term investor outcomes. We don’t treat all six as equal — some, like financial health and valuation, carry meaningfully more weight than others.
QUALATATIVE AND QUANTATIVE
QUALATATIVE AND QUANTATIVE
How We Score: Behind the Scenes
Within each pillar, we break our analysis down into specific, checkable sub-factors. Instead of looking at broad generalizations, we inspect the exact mechanics of the business, such as:
Promoter shareholding trends after the company goes public.
Debt-to-equity ratios mapped against interest coverage.
CFO-to-PAT consistency measured over multiple years.
We score each of these sub-factors against our own internal benchmarks – built by analyzing dozens of past IPOs and tracking their actual post-listing performance.
Why We Keep Our Scoring Proprietary
We deliberately hide the exact point allocations and scoring thresholds for two main reasons:
Protecting Intellectual Property: The model represents years of proprietary, analytical hard work.
Preventing “Gaming” of the System: If we make the scoring system fully public, companies and investment bankers can easily game it. They could simply tailor the language in their Draft Red Herring Prospectus (DRHP) to hit our specific thresholds, without actually improving the underlying business.
What the final number means
Once every pillar is scored and weighted, we arrive at a single number out of 100. Broadly:
- Strong scores indicate businesses with clean capital use, credible management, solid financials, and reasonable pricing – the kind of IPO worth serious consideration.
- Mid-range scores usually mean a mixed bag – a good business at a stretched price, or a reasonable price attached to a business with some governance or financial question marks.
- Low scores are usually a signal to sit out, regardless of how loud the listing-day hype gets.
We publish the final score and the reasoning behind each pillar in our IPO breakdowns, so you understand why a company scored the way it did – without us handing over the exact formula that produced it.
Why this matters
Grey market premium tells you what traders expect to happen tomorrow. It tells you nothing about whether the business is worth owning for the next five years. Our score is an attempt to answer the second question, using the same document SEBI itself requires every company to file truthfully.
It’s not perfect, and no scoring model ever is – but it’s built on filings, not feelings.
ipocorner.in
