

Jio Platforms IPO Score: DRHP-Based Analysis of Financials, Valuation and Key Factors
3 October 2026
October 3, 2026 · IPO analysis Jio Platforms Limited is preparing for its proposed IPO, and the DRHP offers plenty of data for judging its financial strength, business moat, promoters, use of proceeds and valuation. Using an IPO Score sheet built from that data, Jio Platforms scores 71.41 out of 100, which falls in the “above average” band. The framework rates the IPO across six areas. This post explains how the score is built and which numbers investors should study. Treat the score as a structured reading of the DRHP, not a forecast of listing gains. The score at a glance Category Score Max Share of max Business moat and competitive advantage 10 10 100% Offer structure quality 8 8 100% Financial health 20 25 80% Promoters and management 12.5 16 78% Valuation and pricing 10.91 21 52% Use of proceeds 10 20 50% Total 71.41 100 71% Financial Health carries the highest weight (25 points). Valuation (21) and Use of Proceeds (20) follow, and these are also the two weakest scores. Use of proceeds: 10/20 The issue is a fresh issue of 27 crore equity shares with no Offer for Sale. About ₹27,500 crore is earmarked to repay or prepay borrowings. Debt repayment earns full marks within this section because it can strengthen the balance sheet and cut future interest costs. The score is held at 10/20 because the workbook shows no meaningful proceeds for growth capex, working capital or acquisitions. The result is a clear balance-sheet objective, but little money directed at expansion. Offer structure: 8/8 A 100% fresh issue earns full marks. Every rupee raised goes to the company rather than to selling shareholders, which is the key difference between a fresh issue and an OFS. Note that “to the company” here largely means debt reduction, not new growth spending. Promoters and management: 12.5/16 The DRHP highlights deep Reliance group experience: Mukesh D. Ambani with about 40 years, Manoj H. Modi about 30 years, and Akash M. Ambani and Isha M. Ambani about 12 years each. Track record and promoter shareholding after the IPO score the maximum, and governance and capital allocation score well. The litigation and regulatory component scores zero because of the number of cases under various sections, which pulls the section down. Investors should read experience alongside governance disclosures, related-party transactions and regulatory matters, not rely on the promoter name alone. Financial health: 20/25 Revenue, profit and EPS Metric FY2024 FY2025 FY2026 2-year CAGR Revenue (₹ Cr) 109,558.1 128,218.4 146,885.3 15.8% PAT (₹ Cr) 21,423.2 26,109.0 30,049.1 18.4% Diluted EPS (₹) 23.93 29.17 33.59 18.5% Net margin 19.6% 20.4% 20.5% n/a All three lines rise every year, which supports the strong growth scores. Growth did slow in FY26, with revenue up 14.6% (from 17.0% in FY25) and PAT up 15.1% (from 21.9%). Return ratios: 2/5 ROE improved from 7.70% to 8.56% and then 8.94%, which is the right direction but still under 10%. ROCE is about 12% against roughly 19% for listed peers. These are the weakest points in the financial picture. Leverage The debt-to-equity ratio was 0.20x, 0.24x and 0.21x across FY24 to FY26, which is moderate. Interest coverage was 8.12x, 8.16x and 5.66x. Both debt metrics earn full marks, but the drop in coverage in FY26 is worth watching, as is the ₹27,500 crore repayment plan. A data point to treat carefully The workbook records operating margin at about 100%, 96.58% and 109.34%. A margin above 100% is not possible under a normal definition, so this looks like a calculation or definition issue in the source. Check the exact formula in the underlying statements before using it for peer comparison, and be cautious about its 3/4 score. Net margin, shown above, is a safer yardstick. Business moat and brand strength: 10/10 Jio had over 524.4 million customers as of March 31, 2026, and its mobile subscriber base passed 533 million by June 2026. It also reports about 268.5 million 5G customers and 27.1 million fixed-broadband customers. Scale, spectrum and infrastructure needs create high entry barriers, and brand strength, switching costs and industry tailwinds all score the maximum. The ecosystem spans 5G, broadband, cloud, entertainment, gaming, IoT, enterprise solutions, cybersecurity and AI services, giving several ways to earn revenue. A perfect score is generous, though. Competition from other large operators, tariff and ARPU pressure, regulation and heavy network spending are real counterweights. Valuation and pricing: 10.91/21 Applying peer multiples to FY2026 diluted EPS of ₹33.59, IPOCorner.in estimates a price range of about ₹1,030 to ₹1,150 per share. That equals roughly 30.7x to 34.2x FY26 earnings. The PEG ratio is about 1.40, which earns 2/3. EBITDA versus peers is above average and lifts the score, while the premium-justification test for margins and ROCE scores poorly. A final price above this range would look expensive on the model’s logic, but the range is one estimate, not a verdict. A great business is not automatically a cheap IPO. What to watch before applying The final price band against the ₹1,030–1,150 reference range Whether ROE (8.94%) and ROCE (about 12%) keep improving toward peer levels Interest coverage after the debt repayment The litigation and regulatory disclosures in the final offer documents Updated financials and the final issue size Bottom line A 100% fresh issue, strong promoter experience, rising revenue and profit, moderate leverage and a dominant market position support the 71.41/100 score. Modest return ratios, proceeds that go mainly to debt, regulatory matters and valuation hold it back. Revisit the analysis once the price band and complete offer documents are out. This post is based on a DRHP-derived scoring workbook and is for information only. It is not investment advice or a guarantee of listing gains or returns.

The IPO Score of Veegaland Developers Limited: 73.3 out of 100
3 September 2026
Veegaland Developers Limited is a Kerala’s real estate which is about to get it listed on the stock market. It is a Kochi-rooted residential builder with nearly two decades of project execution and experience behind it. Veegaland Developers Limited filed its DRHP with SEBI on December 30, 2025. The IPO features entirely as a Fresh Issue up to ₹ 210 Crore. Subscription date to apply for Veegaland Developers Limited opens on 10th Sep’26 & Closes on 15th Sep’26. Price band for the IPO is ₹ 130 – ₹ 140.
Ardee Engineering, Dhoot Transmission, Technocraft Ventures Massive GMP Surge
6 August 2026
Ardee Engineering, Dhoot Transmission, Technocraft Ventures Massive GMP Surge
How we score IPO
15 July 2026
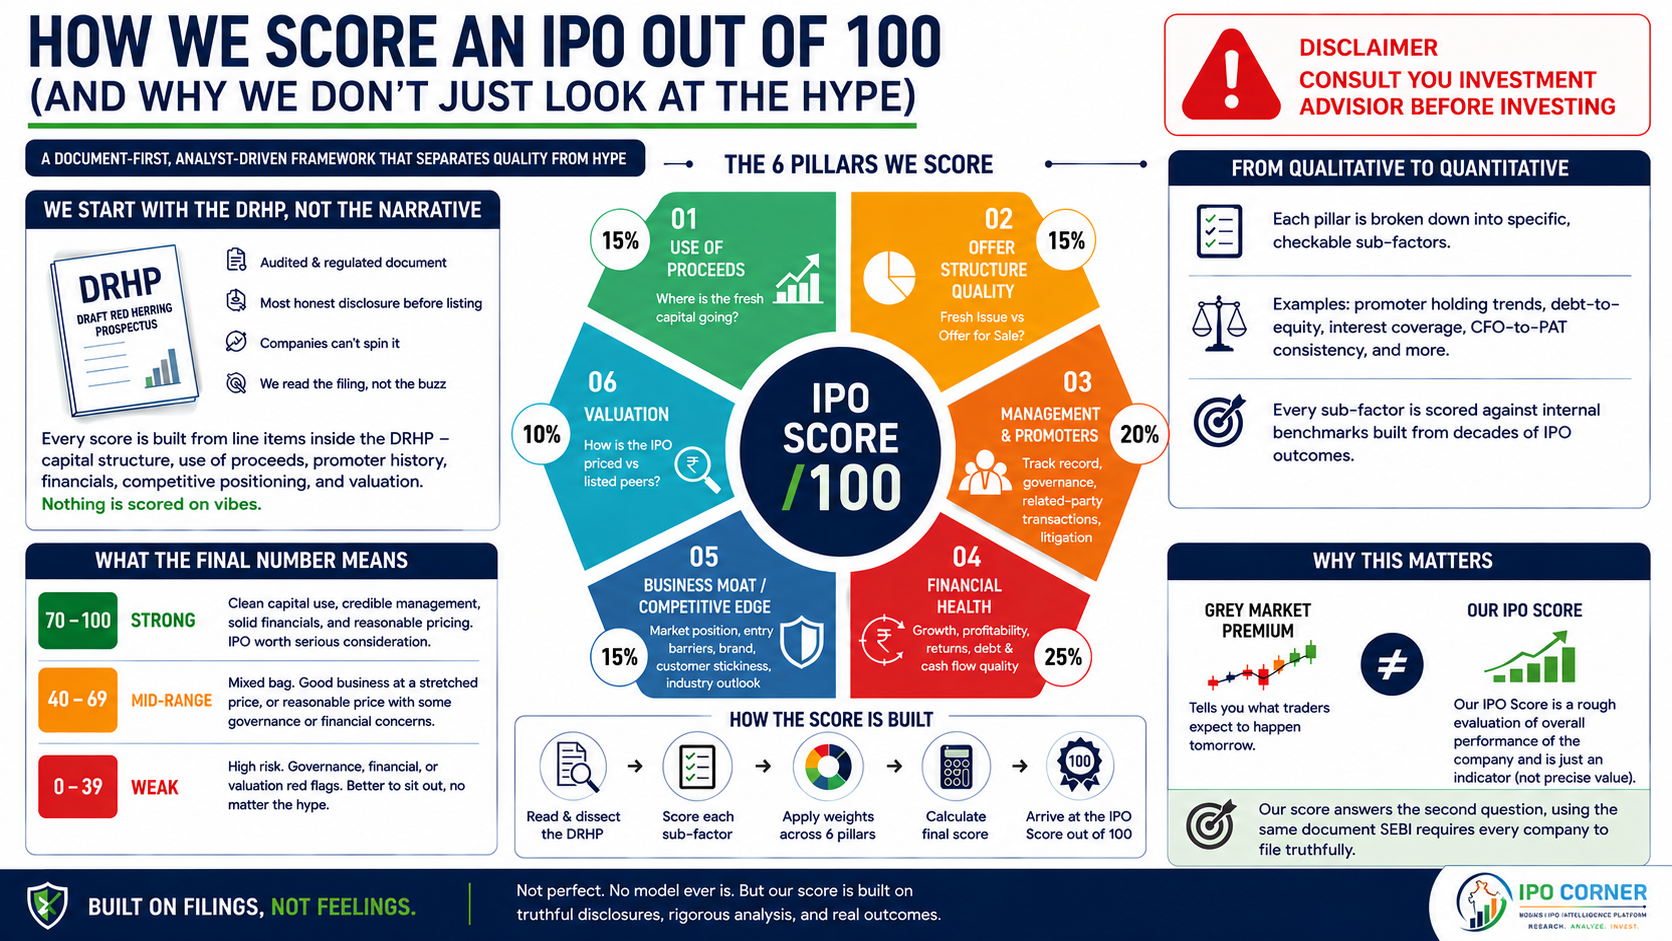
How We Score an IPO Out of 100 (And Why We Don’t Just Look at the Hype) ? Every IPO season, the same thing happens. A company files its DRHP, the grey market premium starts doing the rounds on Telegram, influencers post “MUST APPLY 🔥” reels, and retail investors are left trying to figure out whether they’re buying into a genuinely good business – or just good marketing. We built a scoring framework to cut through that noise. It’s not a black box, and it’s not a gut-feel rating either. It’s a structured, document-first system that reads the DRHP the way a serious analyst would, and converts qualitative business reality into a number out of 100. Here’s how it works — and just as importantly, why we built it this way. We start with the DRHP, not the narrative The Draft Red Herring Prospectus is the single most honest document a company will publish about itself before listing. It’s audited, it’s regulated, and companies can’t spin it the way they spin an investor call or a press release. So instead of starting with “what’s the buzz,” we start with “what does the filing actually say.” Every score we publish is built from line items inside the DRHP — capital structure, use of proceeds, promoter history, financials, competitive positioning, and valuation. Nothing is scored on vibes. The six pillars we score We break every IPO down into six broad dimensions. Each one captures a different kind of risk or opportunity that retail investors typically don’t have the time (or the filing-reading patience) to evaluate themselves: Use of Proceeds – Where is the fresh capital actually going? Growth capex, debt reduction, and expansion tell a very different story than “general corporate purposes,” which is often a red flag for vague capital planning. Offer Structure Quality – How much of the issue is a fresh issue (money going into the company) versus an Offer for Sale (money going straight to existing shareholders, including promoters or PE investors cashing out)? Management & Promoters – Track record, governance history, related-party dealings, capital allocation discipline, and any regulatory or litigation baggage. This is where a lot of “good business, risky bet” situations get flagged. Financial Health – Revenue growth, profitability trends, return ratios, debt position, and cash flow quality relative to reported profit. We specifically look at whether accounting profit is backed by real cash generation. Business Moat / Competitive Edge – Market position, entry barriers, brand strength, customer stickiness, and whether the industry itself has tailwinds or headwinds. Valuation – How the IPO is priced relative to listed peers, on earnings, margins, and growth-adjusted metrics — because even a great business can be a bad investment at the wrong price. Each of these pillars carries a different weight in the final score, reflecting how much it typically matters to long-term investor outcomes. We don’t treat all six as equal — some, like financial health and valuation, carry meaningfully more weight than others. How We Score: Behind the Scenes Within each pillar, we break our analysis down into specific, checkable sub-factors. Instead of looking at broad generalizations, we inspect the exact mechanics of the business, such as: Promoter shareholding trends after the company goes public. Debt-to-equity ratios mapped against interest coverage. CFO-to-PAT consistency measured over multiple years. We score each of these sub-factors against our own internal benchmarks – built by analyzing dozens of past IPOs and tracking their actual post-listing performance. Why We Keep Our Scoring Proprietary We deliberately hide the exact point allocations and scoring thresholds for two main reasons: Protecting Intellectual Property: The model represents years of proprietary, analytical hard work. Preventing “Gaming” of the System: If we make the scoring system fully public, companies and investment bankers can easily game it. They could simply tailor the language in their Draft Red Herring Prospectus (DRHP) to hit our specific thresholds, without actually improving the underlying business. What the final number means Once every pillar is scored and weighted, we arrive at a single number out of 100. Broadly: Strong scores indicate businesses with clean capital use, credible management, solid financials, and reasonable pricing – the kind of IPO worth serious consideration. Mid-range scores usually mean a mixed bag – a good business at a stretched price, or a reasonable price attached to a business with some governance or financial question marks. Low scores are usually a signal to sit out, regardless of how loud the listing-day hype gets. We publish the final score and the reasoning behind each pillar in our IPO breakdowns, so you understand why a company scored the way it did – without us handing over the exact formula that produced it. Why this matters Grey market premium tells you what traders expect to happen tomorrow. It tells you nothing about whether the business is worth owning for the next five years. Our score is an attempt to answer the second question, using the same document SEBI itself requires every company to file truthfully. It’s not perfect, and no scoring model ever is – but it’s built on filings, not feelings. ipocorner.in

What is DRHP? (Draft Red Herring Prospectus)
1 January 2026
A DRHP (Draft Red Herring Prospectus) is a preliminary legal document that a company files with SEBI (Securities and Exchange Board of India) before launching an IPO.

What is an IPO? Why do companies raise money via IPO?
31 December 2025
An IPO (Initial Public Offering) is the process of raising funds by which a private company offers its shares to the public to invest for the first time and gets listed on a stock exchange and in return they receive funds from investors which is used to fulfil various purpose as proposed by company.