

October 3, 2026 · IPO analysis
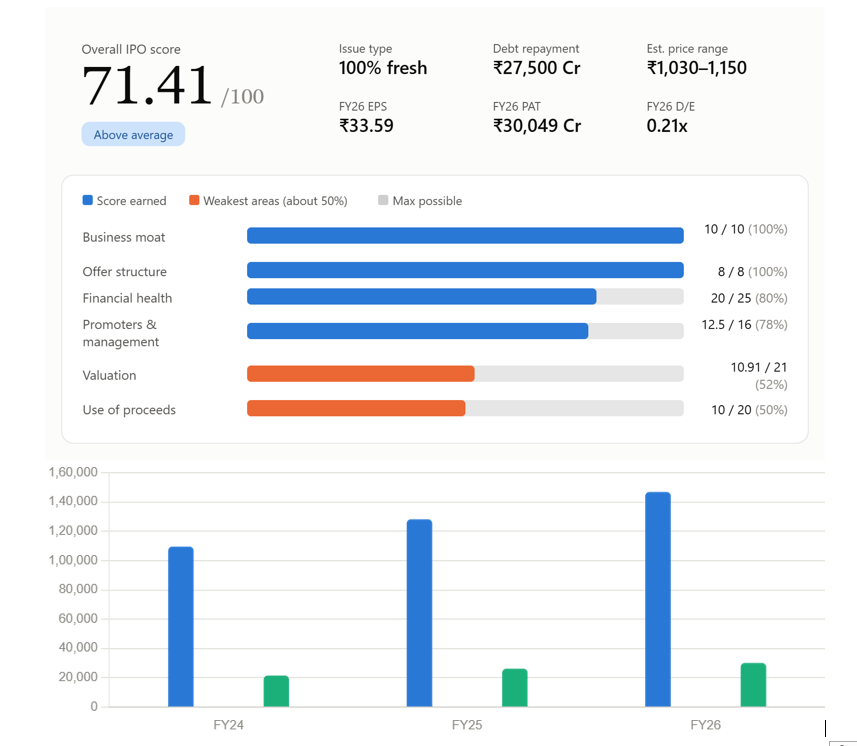
Jio Platforms Limited is preparing for its proposed IPO, and the DRHP offers plenty of data for judging its financial strength, business moat, promoters, use of proceeds and valuation. Using an IPO Score sheet built from that data, Jio Platforms scores 71.41 out of 100, which falls in the “above average” band.
The framework rates the IPO across six areas. This post explains how the score is built and which numbers investors should study. Treat the score as a structured reading of the DRHP, not a forecast of listing gains.
The score at a glance
| Category | Score | Max | Share of max |
|---|---|---|---|
| Business moat and competitive advantage | 10 | 10 | 100% |
| Offer structure quality | 8 | 8 | 100% |
| Financial health | 20 | 25 | 80% |
| Promoters and management | 12.5 | 16 | 78% |
| Valuation and pricing | 10.91 | 21 | 52% |
| Use of proceeds | 10 | 20 | 50% |
| Total | 71.41 | 100 | 71% |
Financial Health carries the highest weight (25 points). Valuation (21) and Use of Proceeds (20) follow, and these are also the two weakest scores.
Use of proceeds: 10/20
The issue is a fresh issue of 27 crore equity shares with no Offer for Sale. About ₹27,500 crore is earmarked to repay or prepay borrowings.
Debt repayment earns full marks within this section because it can strengthen the balance sheet and cut future interest costs. The score is held at 10/20 because the workbook shows no meaningful proceeds for growth capex, working capital or acquisitions. The result is a clear balance-sheet objective, but little money directed at expansion.
Offer structure: 8/8
A 100% fresh issue earns full marks. Every rupee raised goes to the company rather than to selling shareholders, which is the key difference between a fresh issue and an OFS. Note that “to the company” here largely means debt reduction, not new growth spending.
Promoters and management: 12.5/16
The DRHP highlights deep Reliance group experience: Mukesh D. Ambani with about 40 years, Manoj H. Modi about 30 years, and Akash M. Ambani and Isha M. Ambani about 12 years each.
Track record and promoter shareholding after the IPO score the maximum, and governance and capital allocation score well. The litigation and regulatory component scores zero because of the number of cases under various sections, which pulls the section down. Investors should read experience alongside governance disclosures, related-party transactions and regulatory matters, not rely on the promoter name alone.
Financial health: 20/25
Revenue, profit and EPS
| Metric | FY2024 | FY2025 | FY2026 | 2-year CAGR |
|---|---|---|---|---|
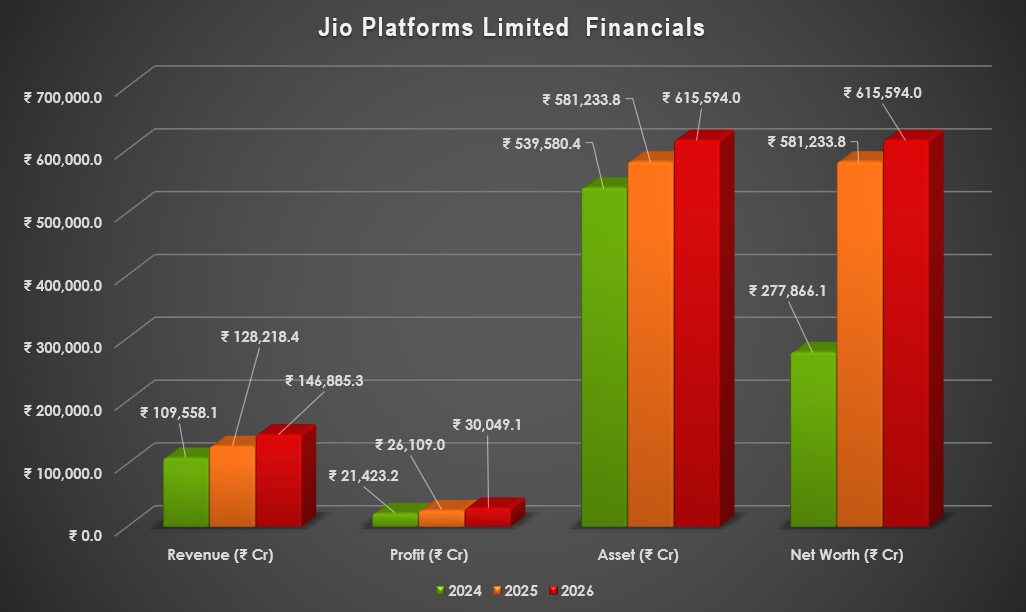
| Revenue (₹ Cr) | 109,558.1 | 128,218.4 | 146,885.3 | 15.8% |
| PAT (₹ Cr) | 21,423.2 | 26,109.0 | 30,049.1 | 18.4% |
| Diluted EPS (₹) | 23.93 | 29.17 | 33.59 | 18.5% |
| Net margin | 19.6% | 20.4% | 20.5% | n/a |
All three lines rise every year, which supports the strong growth scores. Growth did slow in FY26, with revenue up 14.6% (from 17.0% in FY25) and PAT up 15.1% (from 21.9%).
Return ratios: 2/5
ROE improved from 7.70% to 8.56% and then 8.94%, which is the right direction but still under 10%. ROCE is about 12% against roughly 19% for listed peers. These are the weakest points in the financial picture.
Leverage
The debt-to-equity ratio was 0.20x, 0.24x and 0.21x across FY24 to FY26, which is moderate. Interest coverage was 8.12x, 8.16x and 5.66x. Both debt metrics earn full marks, but the drop in coverage in FY26 is worth watching, as is the ₹27,500 crore repayment plan.
A data point to treat carefully
The workbook records operating margin at about 100%, 96.58% and 109.34%. A margin above 100% is not possible under a normal definition, so this looks like a calculation or definition issue in the source. Check the exact formula in the underlying statements before using it for peer comparison, and be cautious about its 3/4 score. Net margin, shown above, is a safer yardstick.
Business moat and brand strength: 10/10
Jio had over 524.4 million customers as of March 31, 2026, and its mobile subscriber base passed 533 million by June 2026. It also reports about 268.5 million 5G customers and 27.1 million fixed-broadband customers.
Scale, spectrum and infrastructure needs create high entry barriers, and brand strength, switching costs and industry tailwinds all score the maximum. The ecosystem spans 5G, broadband, cloud, entertainment, gaming, IoT, enterprise solutions, cybersecurity and AI services, giving several ways to earn revenue.
A perfect score is generous, though. Competition from other large operators, tariff and ARPU pressure, regulation and heavy network spending are real counterweights.
Valuation and pricing: 10.91/21
Applying peer multiples to FY2026 diluted EPS of ₹33.59, IPOCorner.in estimates a price range of about ₹1,030 to ₹1,150 per share. That equals roughly 30.7x to 34.2x FY26 earnings.
The PEG ratio is about 1.40, which earns 2/3. EBITDA versus peers is above average and lifts the score, while the premium-justification test for margins and ROCE scores poorly. A final price above this range would look expensive on the model’s logic, but the range is one estimate, not a verdict. A great business is not automatically a cheap IPO.
What to watch before applying
- The final price band against the ₹1,030–1,150 reference range
- Whether ROE (8.94%) and ROCE (about 12%) keep improving toward peer levels
- Interest coverage after the debt repayment
- The litigation and regulatory disclosures in the final offer documents
- Updated financials and the final issue size
Bottom line
A 100% fresh issue, strong promoter experience, rising revenue and profit, moderate leverage and a dominant market position support the 71.41/100 score. Modest return ratios, proceeds that go mainly to debt, regulatory matters and valuation hold it back. Revisit the analysis once the price band and complete offer documents are out.
This post is based on a DRHP-derived scoring workbook and is for information only. It is not investment advice or a guarantee of listing gains or returns.
